LipidSig: a web-based tool for lipidomic data analysis
FAQ 1: What is LipidSig?
- LipidSig is the first web-based platform which integrates a comprehensive analysis for streamlined data mining of lipidomic datasets.
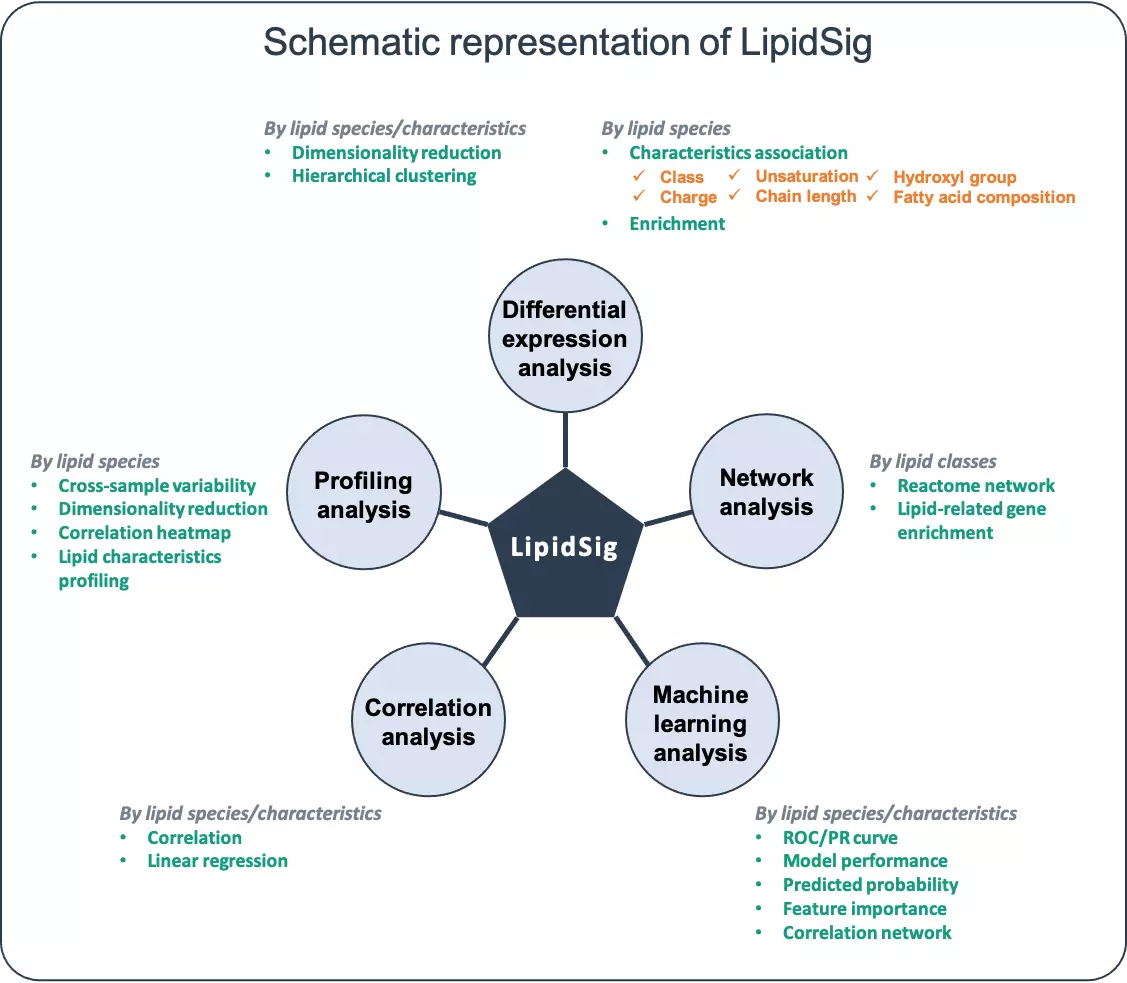
- The user-friendly interface provides five main functions, namely Profiling, Differential expression, Correlation, Network and Machine learning for assessment of lipid effects on biological mechanisms. The five functions provide unique aspects to analyse the lipidome profiling data based on different characteristics including lipid class, chain length, unsaturation, hydroxyl group, and fatty acid composition. In summary, LipidSig enables users to perform intensive lipid analysis and create interactive plots with downloadable images and corresponding tables.
FAQ 2: What is the workflow of LipidSig?
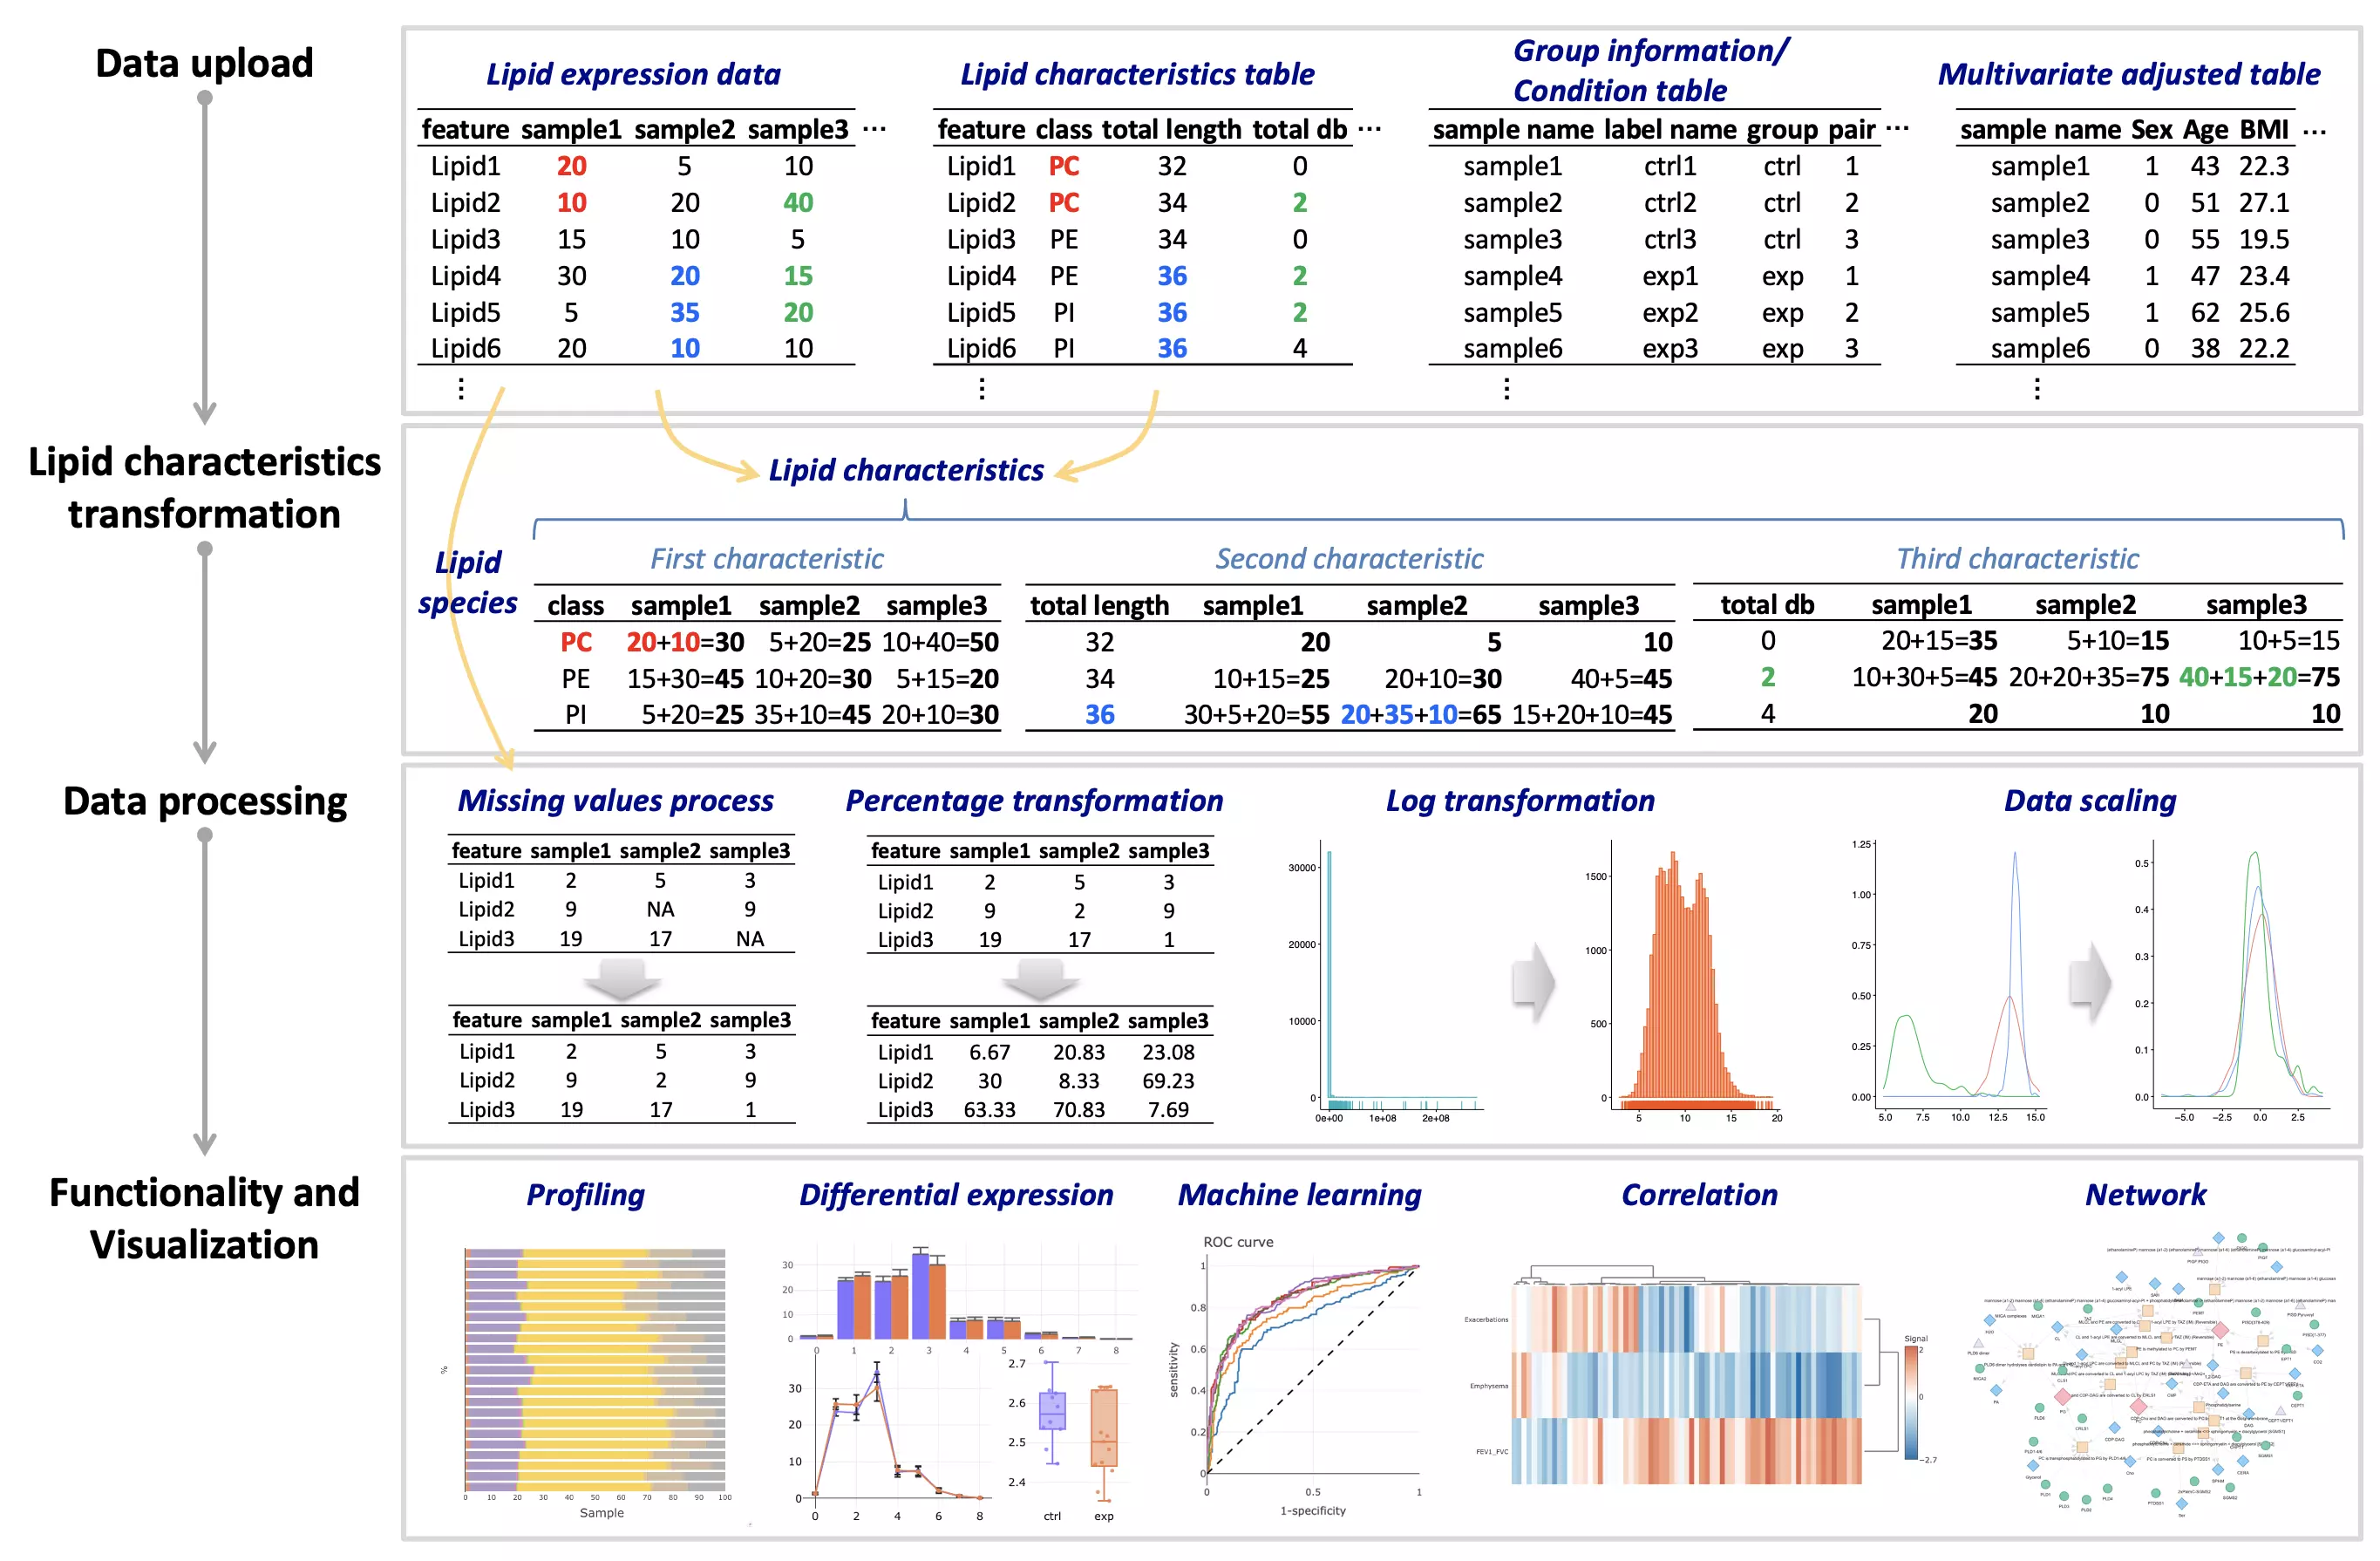
- The workflow of LipidSig is consists of four parts: (i) Data upload, (ii) Lipid characteristics transformation, (iii) Data processing, and (iv) Functionality and Visualization. After uploading the required matrices, users can select and adjust suitable parameters for following steps through a user-friendly interface. LipidSig has built-in lipid species and lipid characteristics two different pipelines that can be freely converted. LipidSig also supports five independent functions and concise visualization to profile lipid expression, identify significant features, or construct an informative network.
FAQ 3: Does LipidSig provide demo dataset?
- Yes, for each section, LipidSig provides various examples from previous papers for researchers to explore functions.
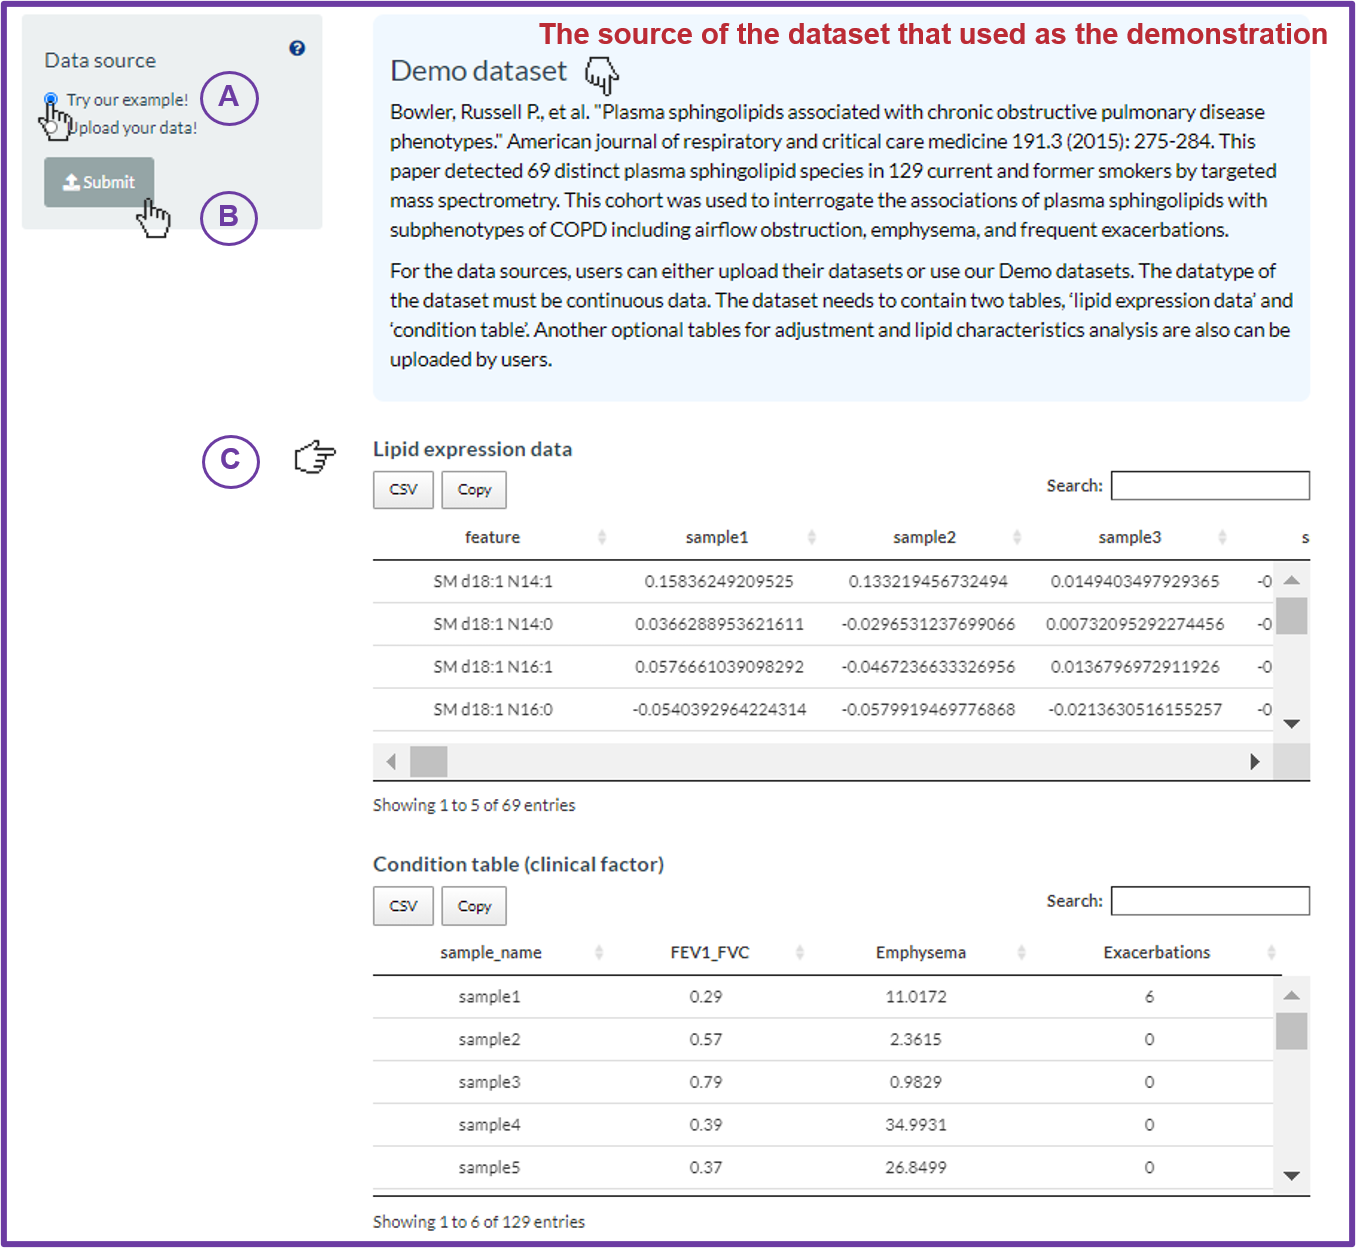
- For example, for “correlation” section, “Plasma sphingolipids associated with chronic obstructive pulmonary disease phenotypes.” by Bowler, Russell P. et al. is used. For “machine learning”, “Profiling analysis” and “Differential expression analysis” chapter, Adipose tissue ATGL modifies the cardiac lipidome in pressure-overload-induced left Ventricular failure (PLoS Genet. 2018) is given.
FAQ 4: How to prepare your dataset?
- For ‘Differential expression analysis’:
-
Step 1:
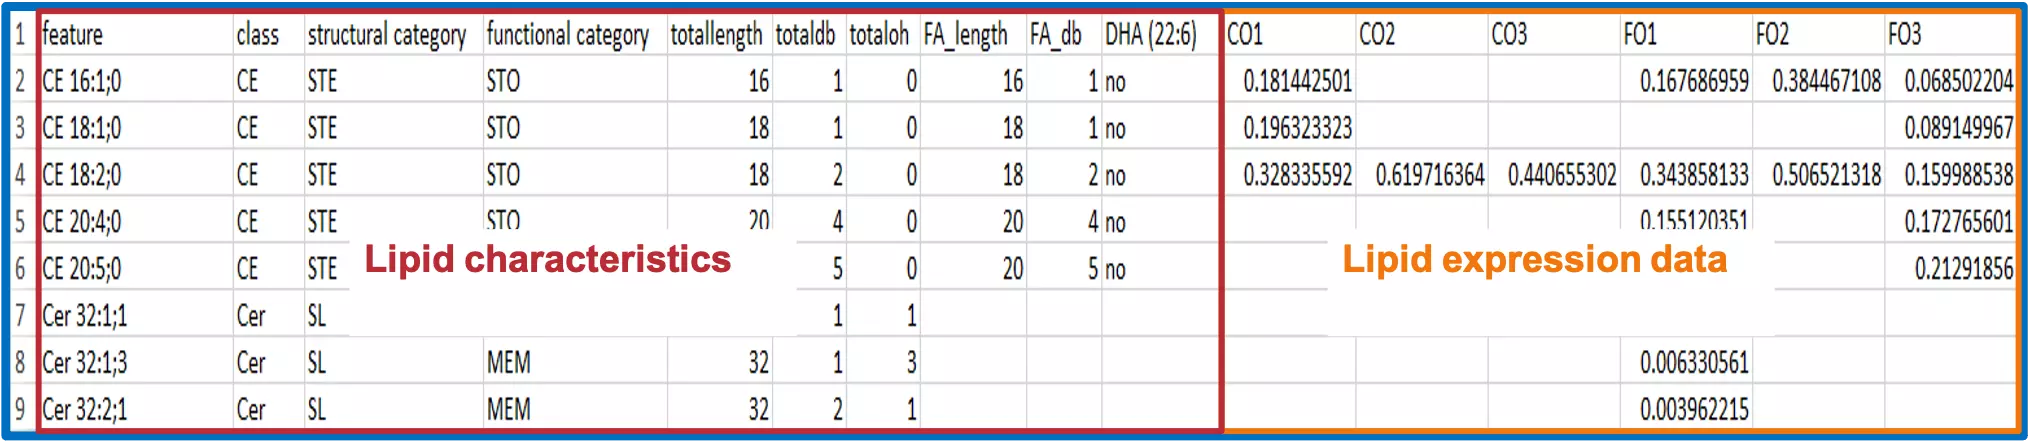
- Organise your raw data. In this example, raw data contains information about ‘Lipid expression data’ and ‘Lipid characteristics’.
- ‘Lipid expression data’ here has 3 samples in each group, CO refers to corn oil (CO) diet, whereas FO represents the fish oil (FO) diet.
- ‘Lipid characteristics’ encompasses a wide variety of lipid characteristics, such as name(feature) of lipid, class of lipid, the total length of lipid, and Fatty acid (FA_) related characteristics.
-
Step 2:
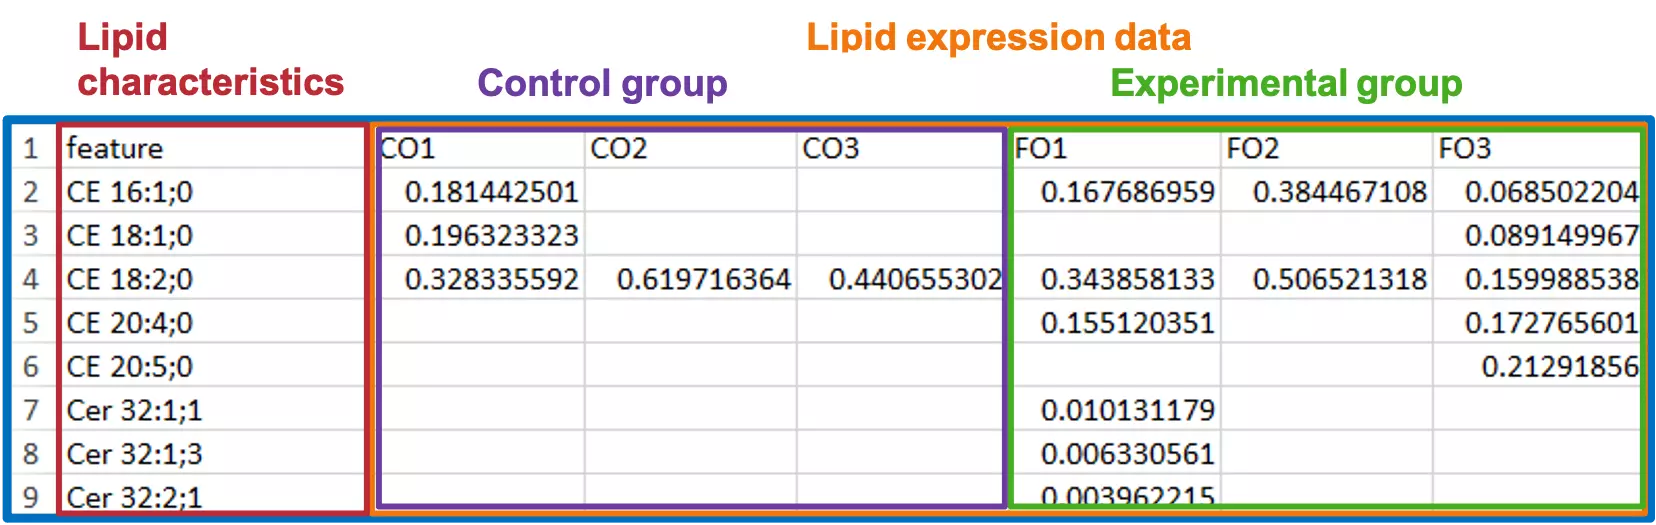
- Now, after confirming the information of your raw data, you are ready to separate them into two tables, the ‘Lipid expression data’ table and the ‘Lipid characteristics’ table. ‘Lipid expression data’ table:
-
Step 3:
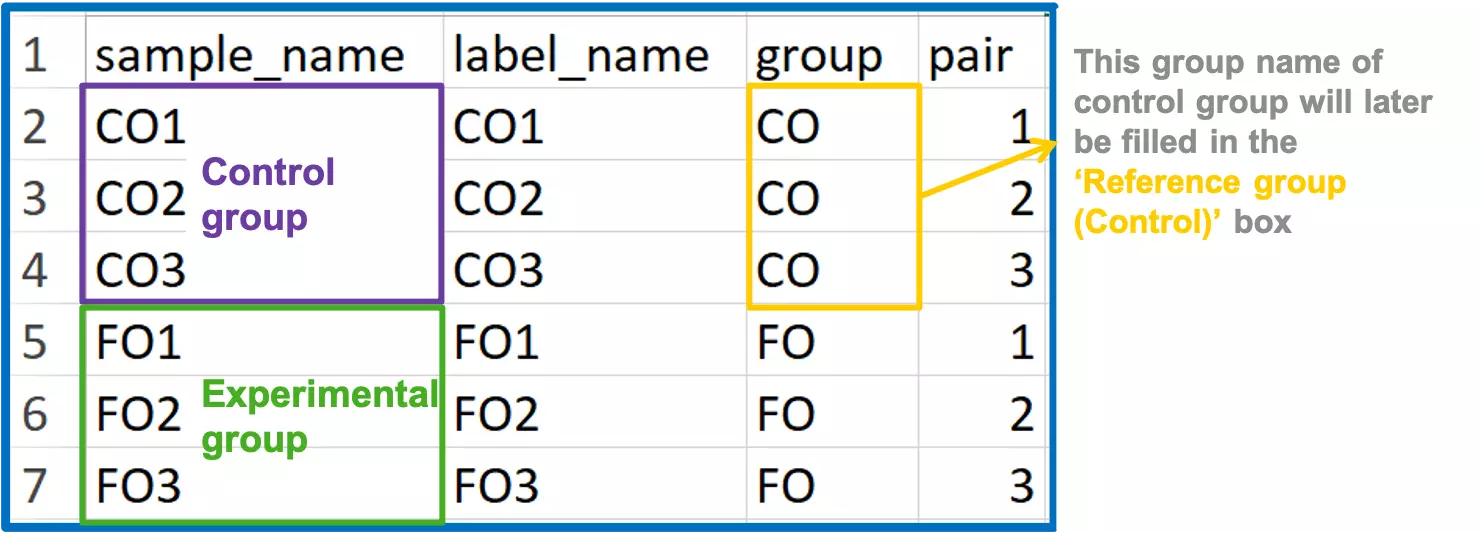
- In order to define the group information for differentially expressed analysis, you may create the ‘Group information’ table.
- ‘Group information’ comprises the name of the sample, the label of the sample, group name of the sample, and the pair number represents ‘the pair’ for the t-test/Wilcoxon test.
-
Step 4:
- All table need to save as csv. Or tsv. Files.
- For ‘Machine learning analysis’:
-
Step 1:
- You may have lipid expression data and demographic data on hand.
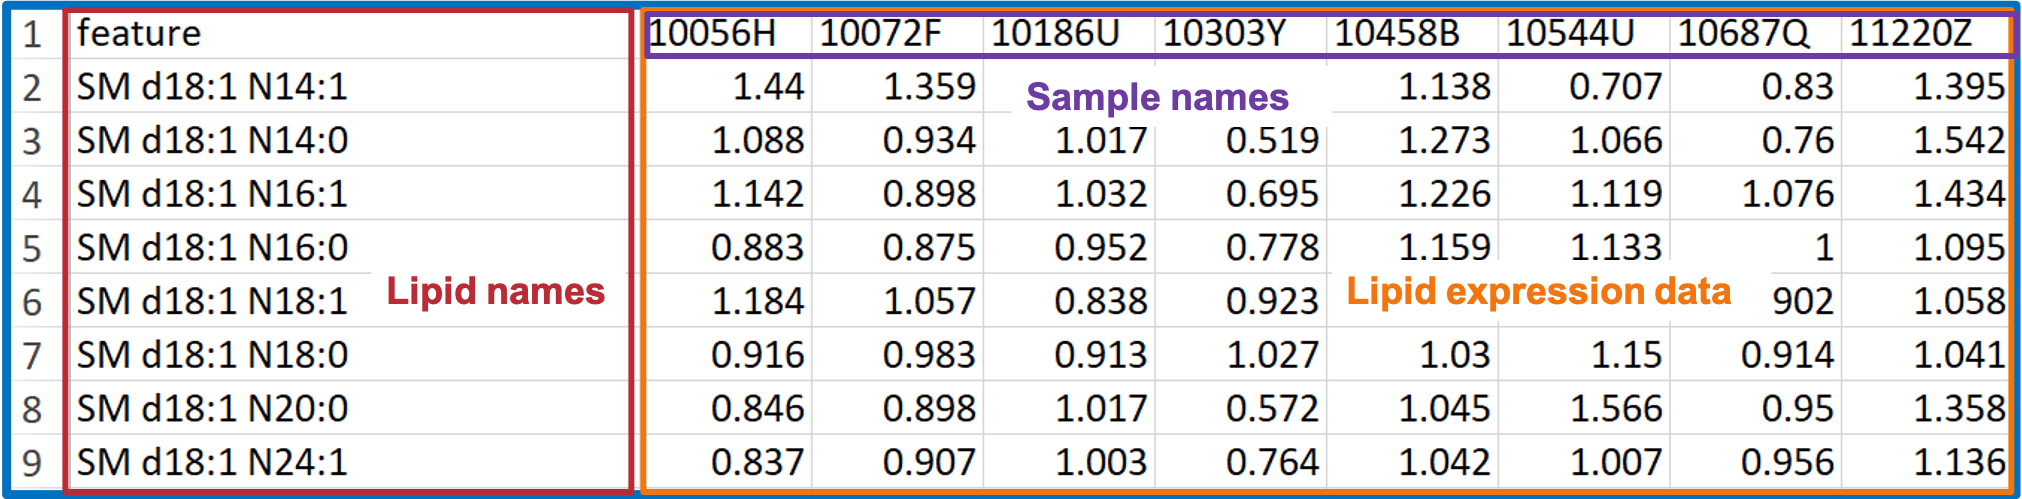
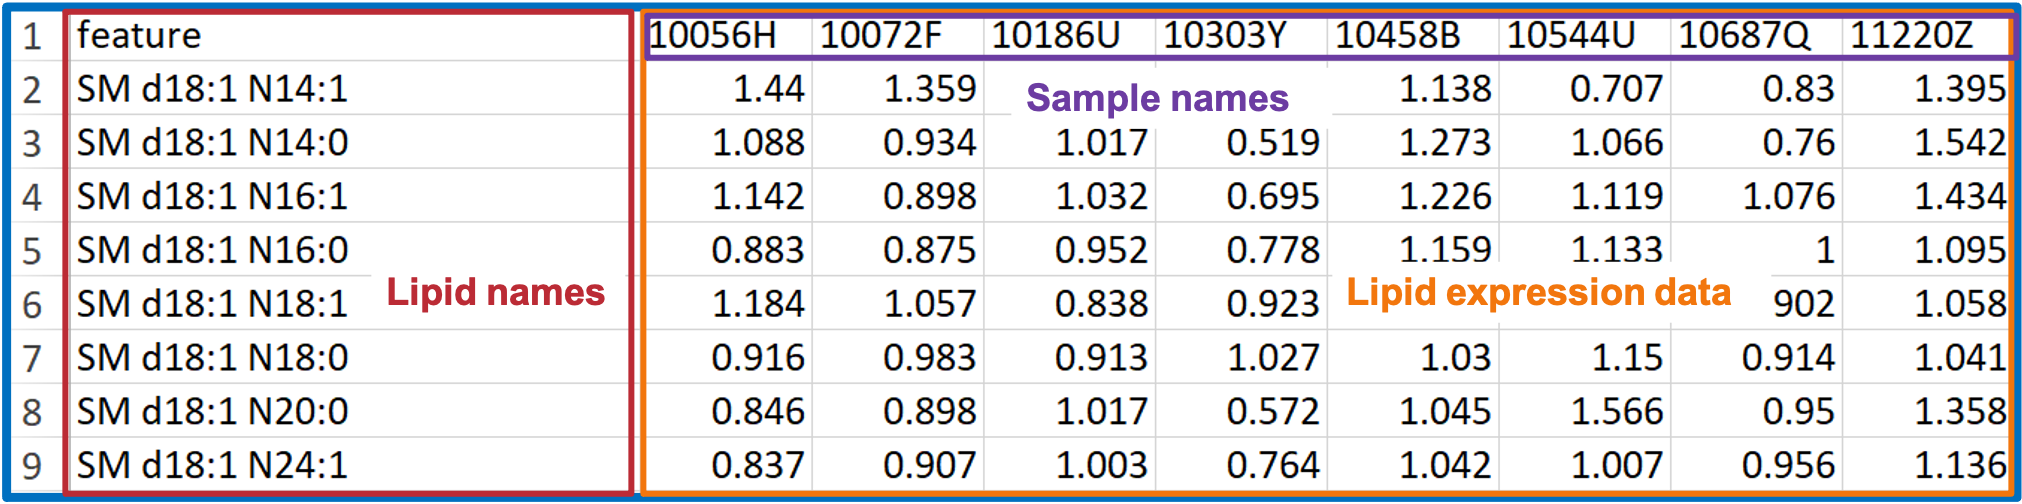
- In this COPD dataset, the ‘Lipid expression data’ table contains the 8 samples of ‘Lipid expression data’ and Lipid features (i.e., features of sphingolipids in this example).
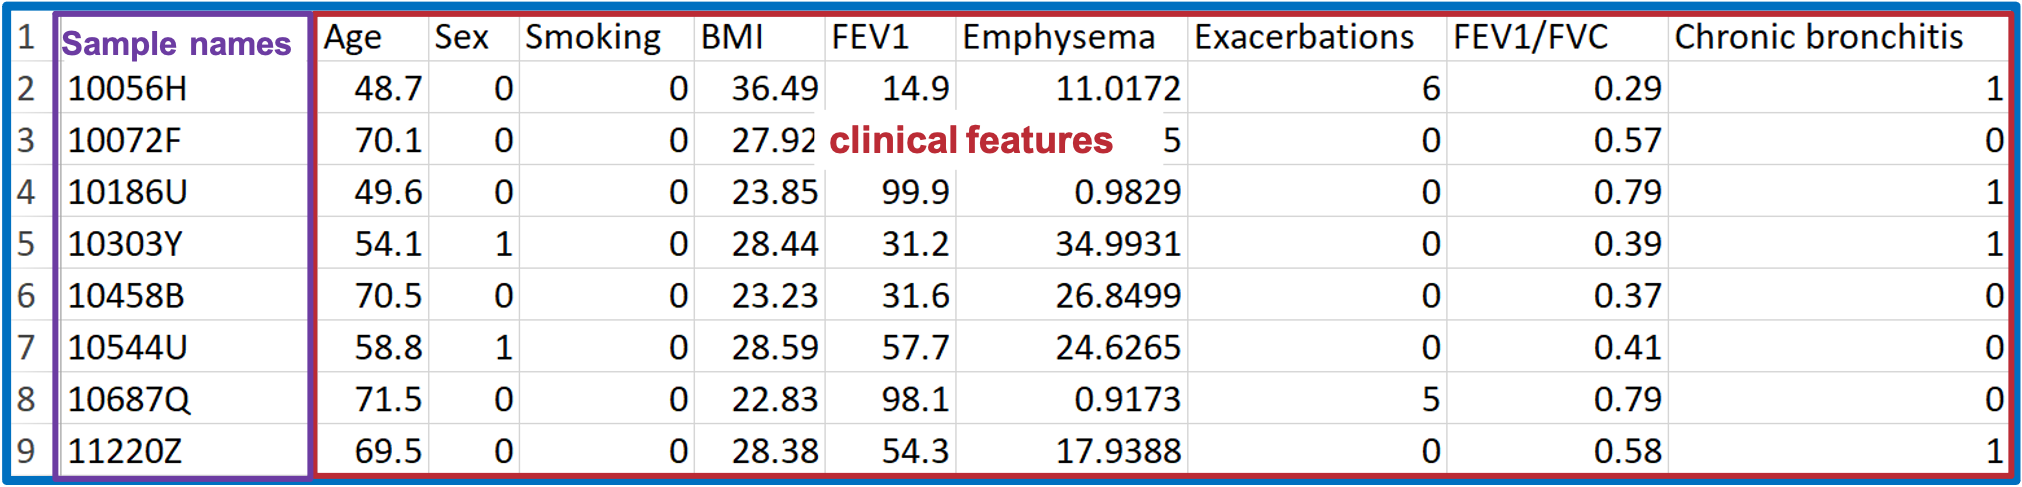
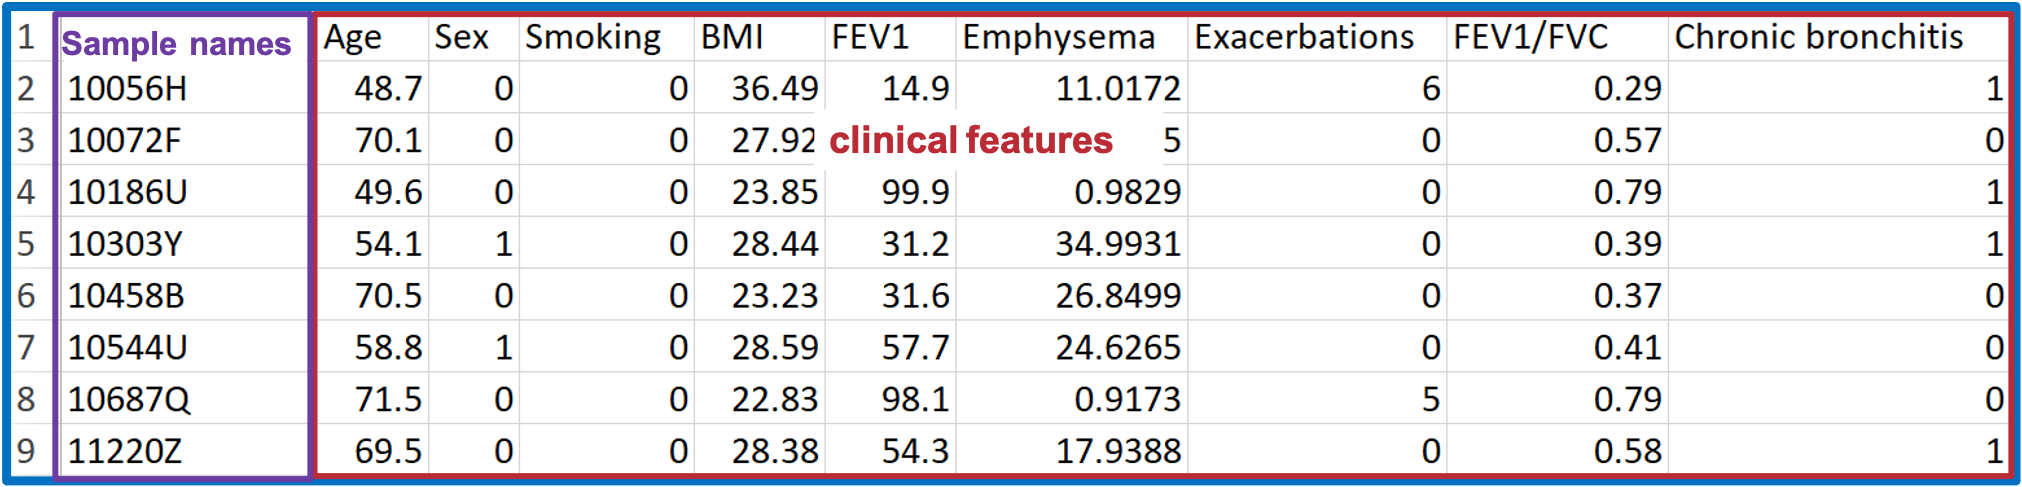
- ‘Demographic’ covers a wide variety of clinical features, such as age, sex, BMI, clinical subphenotypes of COPD, symptoms.
-
Step 2:
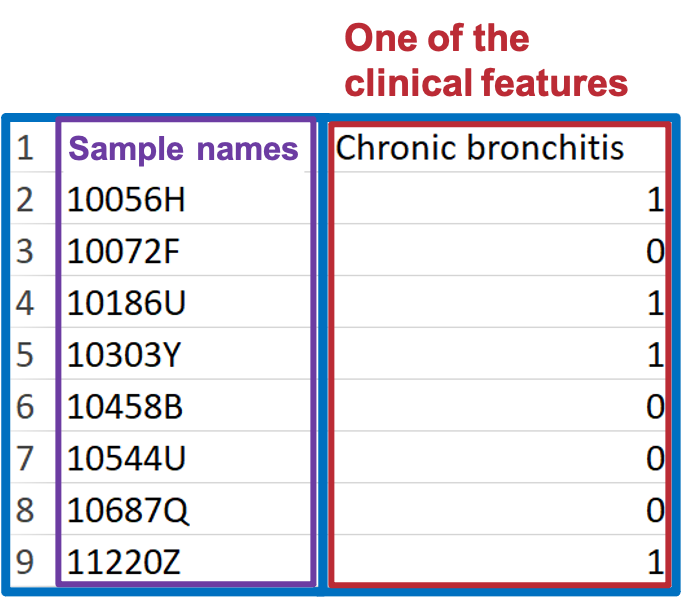
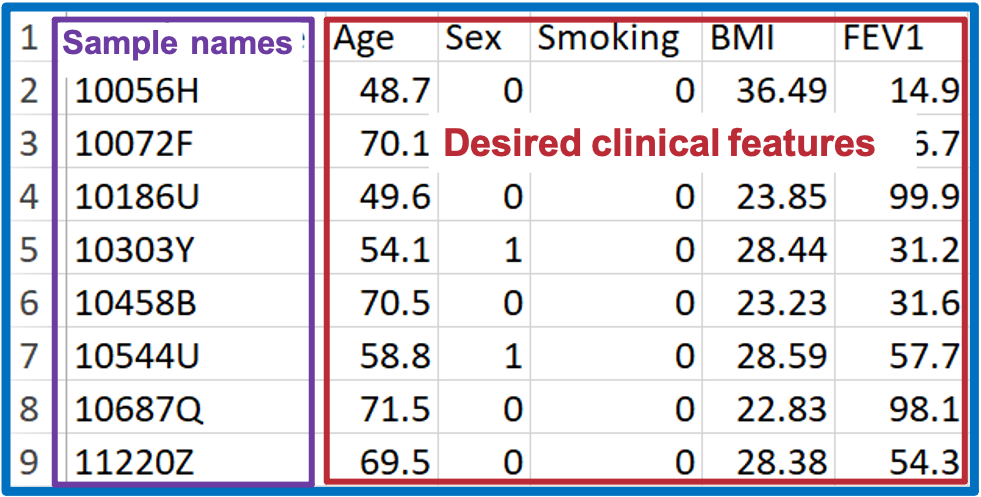
- To build ‘Condition table’, select one clinical term (or one set of clinical terms) from demographic data, and assign a group number to each sample. The group number can only be 0 or 1.
- For the ‘Lipid characteristics’ table, please check the 'Differential expression analysis' part above.
-
Step 3:
- All table need to save as csv. Or tsv. Files.
- For ‘Correlation analysis’:
-
Step 1:
- You may have lipid expression data and demographic data on hand.
- In this COPD dataset, the ‘Lipid expression data’ table contains the 8 samples of ‘Lipid expression data’ and Lipid features (i.e., features of sphingolipids in this example).
- ‘Demographic’ data covers a wide variety of clinical features, such as age, sex, BMI, clinical subphenotypes of COPD, symptoms.
-
Step 2:
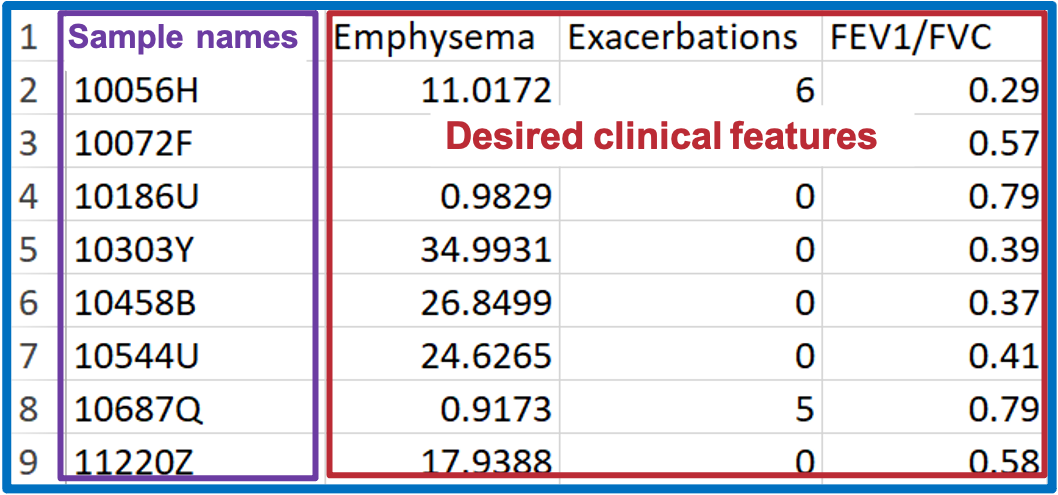
- To build ‘Condition table’, select desired clinical terms (i.e., clinical subphenotypes of COPD) from demographic data.
-
Step 3:
- As for the adjusted table, pick the clinical terms from the demographic table that will be corrected in linear regression or logistic regression analysis
- In terms of the ‘Lipid characteristics’ table, please find more details in the ‘Differential expression analysis’ part.
-
Step 4:
- All table need to save as csv. Or tsv. Files.
FAQ 5: How to upload my dataset?
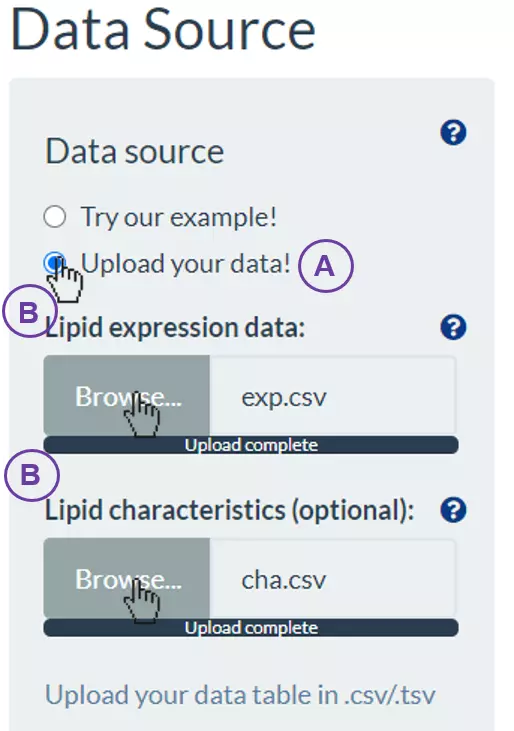
- In each section, except “Network” analysis, LipidSid supports self-uploaded functions. In the left-hand side of page, there is a panel that lists the tables need to be uploaded for the specific analyses.
- Take “Profiling analysis” for example, firstly, (A) click on “Upload your data!”. Then, “Lipid expression data” and “Lipid characteristics (optional)” will show for users to upload (B).
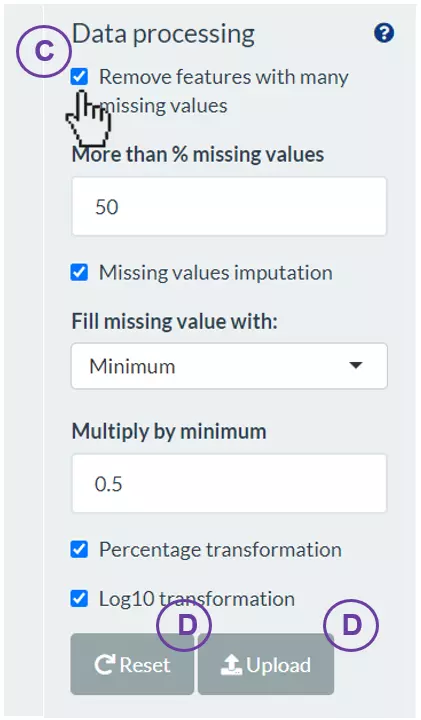
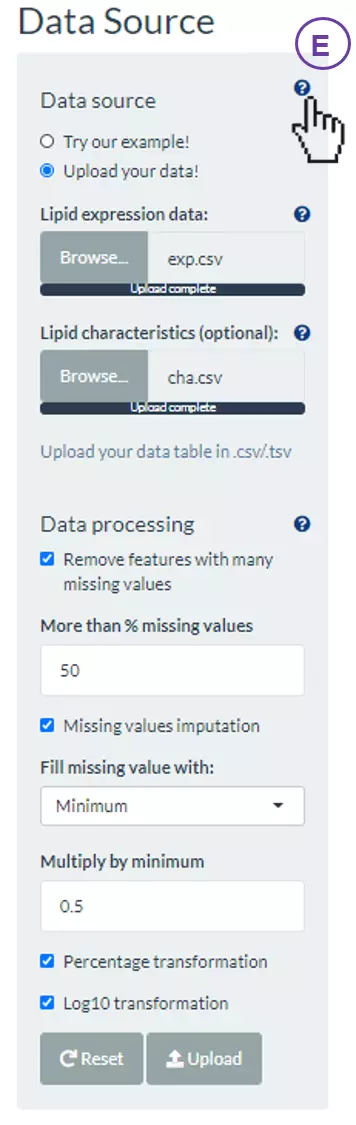
- The “Data processing” section offers several options to manipulate with those values of the tables. (C) Select the desired options to manipulate data and input the values/cut-offs to filter or replace missing data. (D) Press “Upload” to view the tables that users uploaded, or press “Reset” to re-upload.
- (E) For more details, clicking on question mark buttons, the description will show to assist users to decide.
FAQ 6: What kinds of lipidome specific analyses that LipidSig provides?
- One of the most unique functions of LipidSig is to provide a more flexible and expandable platform to transform lipid species expression to characteristics data automatically according to users’ input. The five functions provide a global perspective to analyse the lipidome profiling data based on user-defined characteristics including lipid class, chain length, unsaturation, hydroxyl group, and fatty acid composition.
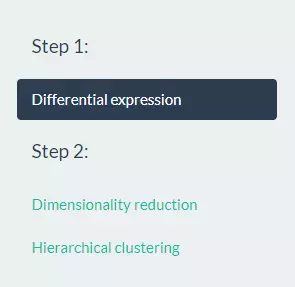
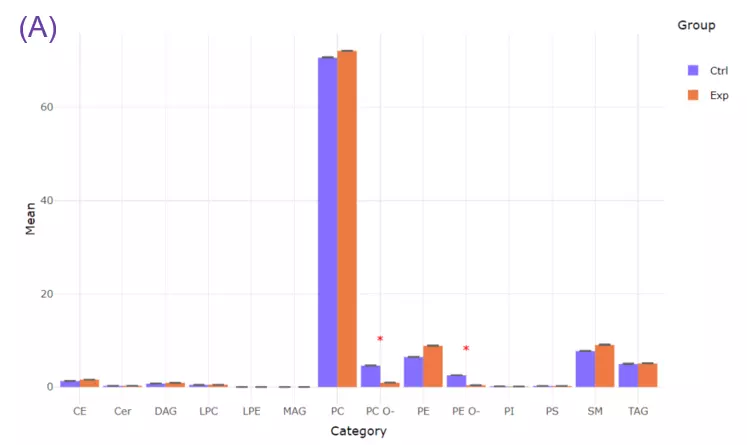
- It is easy to use these lipidome specific analyses. A simple example of using lipidome specific analyses in the ‘Differential expression’ section will be addressed as follow. Firstly, in “Step 1”, the ‘Lipid characteristics analysis’ utilise two-way ANOVA to assist users to find the significant lipid species splitting by the lipid characteristics that user-chosen, such as class, total length. After submission, the difference between these characteristics will be displayed by bar charts, line chart and box plots. Next, in “Step 2”, ‘Dimensionally reduction’ and ‘Hierarchical clustering’ help researchers to discover crucial properties of the lipid data are revealed and still close to its intrinsic characteristics.
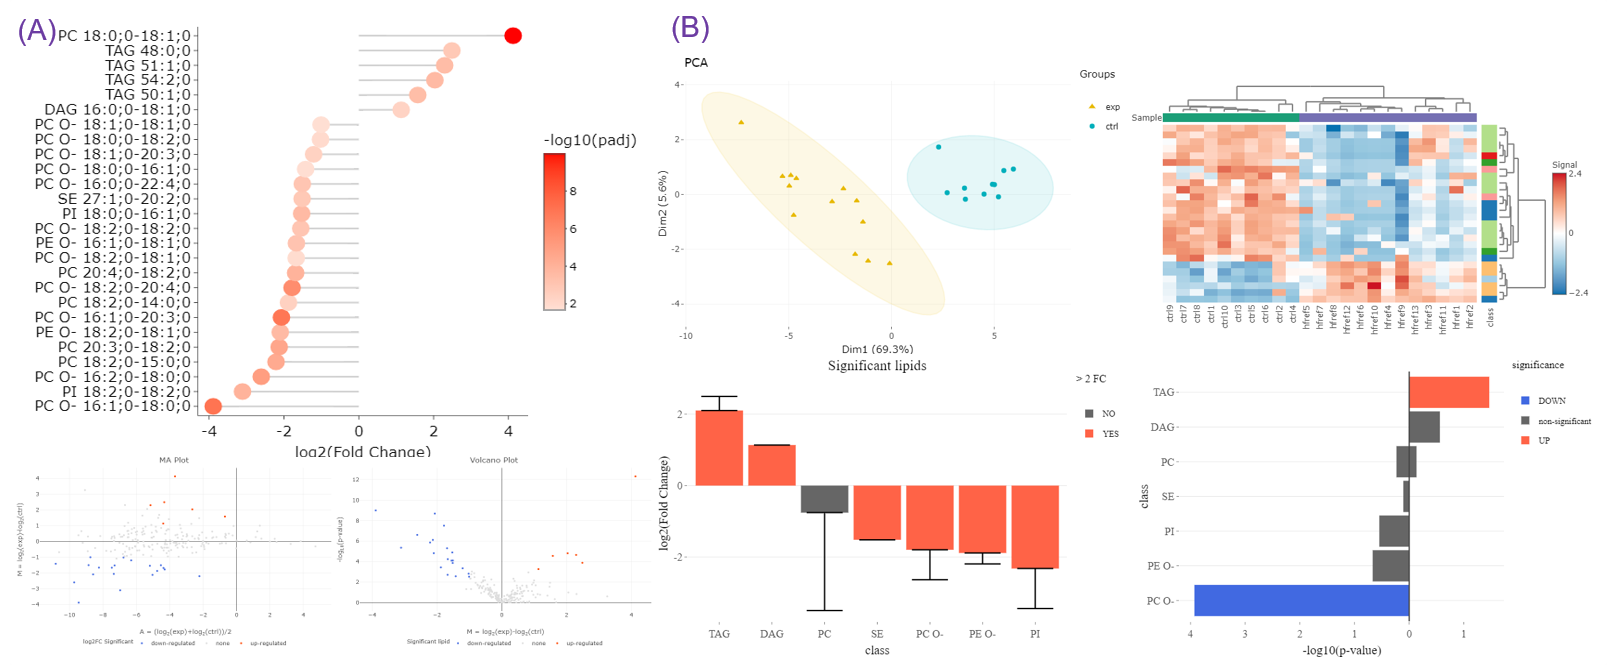
- To exemplify more specifically, lipid class and shape belong to structure-based features and provide an overview of altered lipid metabolism pathways. As shown in Figures A, downregulation of PC O- and PE O- class indicated inhibition of ether lipid biosynthesis pathway.
- On the other hand, we can calculate the numbers of the double bond, chain length, and hydroxyl group that comprise fatty acid diversity. The double bond change reflects membrane unsaturation degree or fluidity and has been connected to signaling transduction (Bi et al., 2019; Levental et al., 2017).
- Recent findings revealed C16:0 ceramide could lead to insulin resistance in obesity, unravelling a new role of specific chain length (Figures B) (Holm et al., 2019; Turpin et al., 2014).
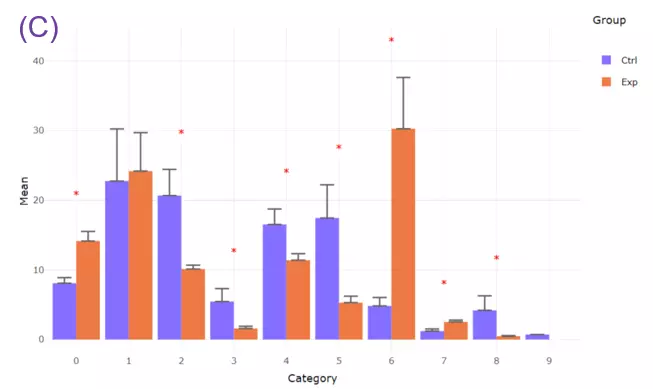
- Moreover, LipidSig also provides an analysis focusing on individual fatty acid instead of lipid species. This allows users to examine different types of polyunsaturated fatty acids (PUFAs) that are stored in lipids and exert special functions. For instance, compared to calculation results of total double bonds in lipid species, an increase in fatty acids with 6 double bonds was more convincible by DHA supplementation (Figure C). PUFA search through fatty acid analysis can be used to explore substrate specificity of acyltransferases, too (Yamashita et al., 2014).
- Further, our web server also enables users to define lipids containing unique PUFAs directly and observe their change (Supplemental Figures S2C) (Kandice R. Levental et al., 2020; Levental et al., 2017).
- Another appealing tool in LipidSig is multiple lipid characteristics analysis. Two factors interaction can be achieved in Differential expression section and is very suitable for the studies that concentrate on specific reactions or pathways. Related applications include PC saturation remodelling catalyzed by LPCAT1 in cancers (Bi et al., 2019)
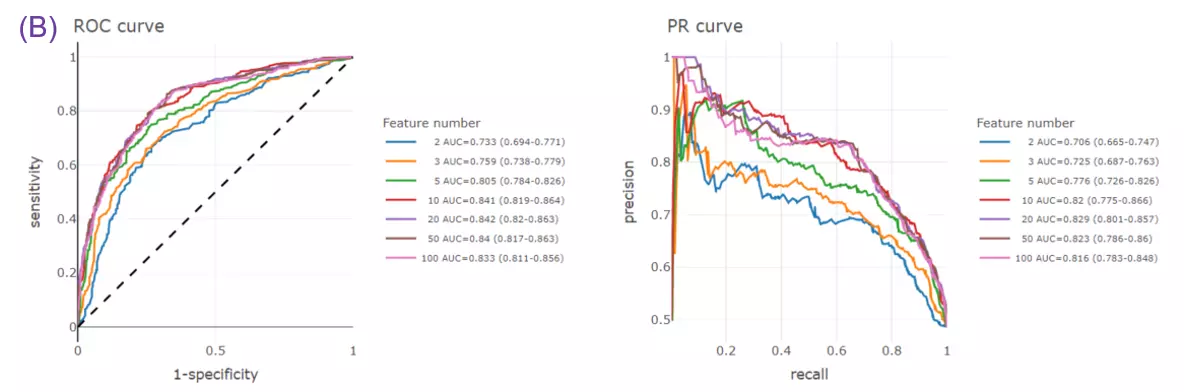
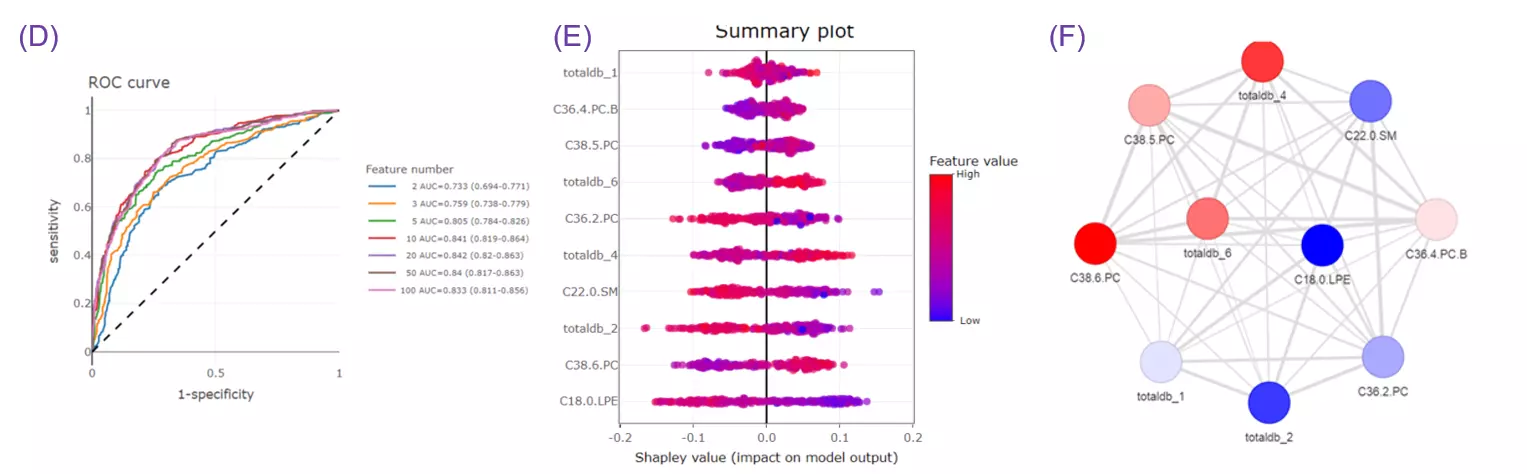
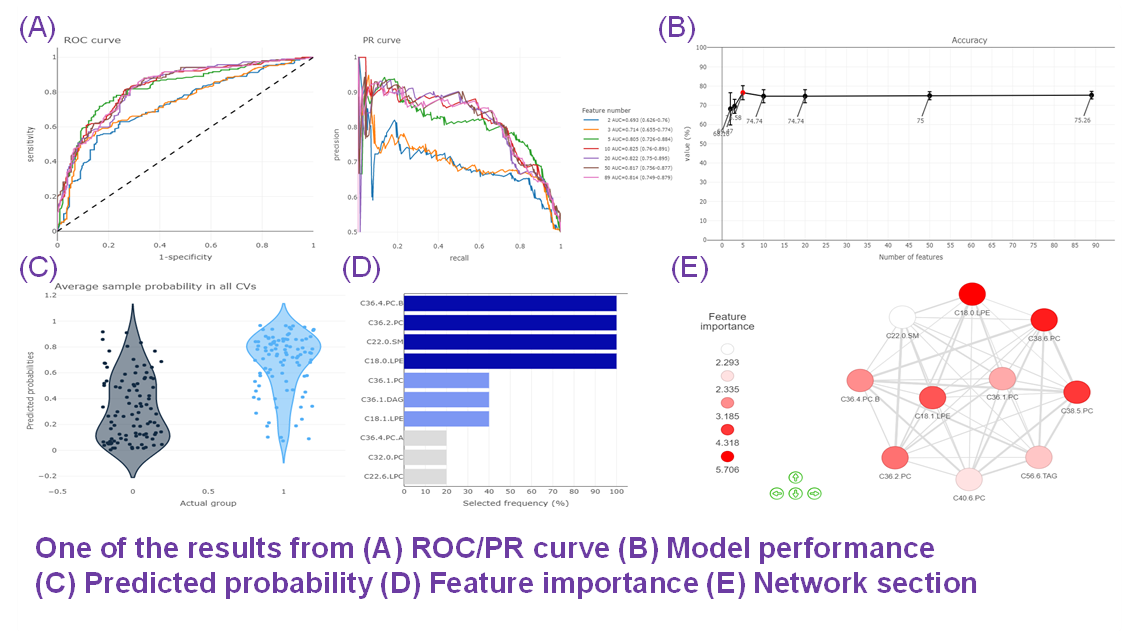
- Given more than two characteristics, users are encouraged to build different machine learning models to evaluate the importance of lipid-related variables. Characteristics introduction can increase the structural or functional resolution of the lipidome and have been used in clinical research (Gerl et al., 2019; Poss et al., 2020) and our example to further improve the model prediction (Figure D-F).
FAQ 7: When to use these analyses? What is the difference?
- LipidSig provides Profiling, Differential expression, Correlation, Network and Machine learning for assessment of lipid effects on biological mechanisms.
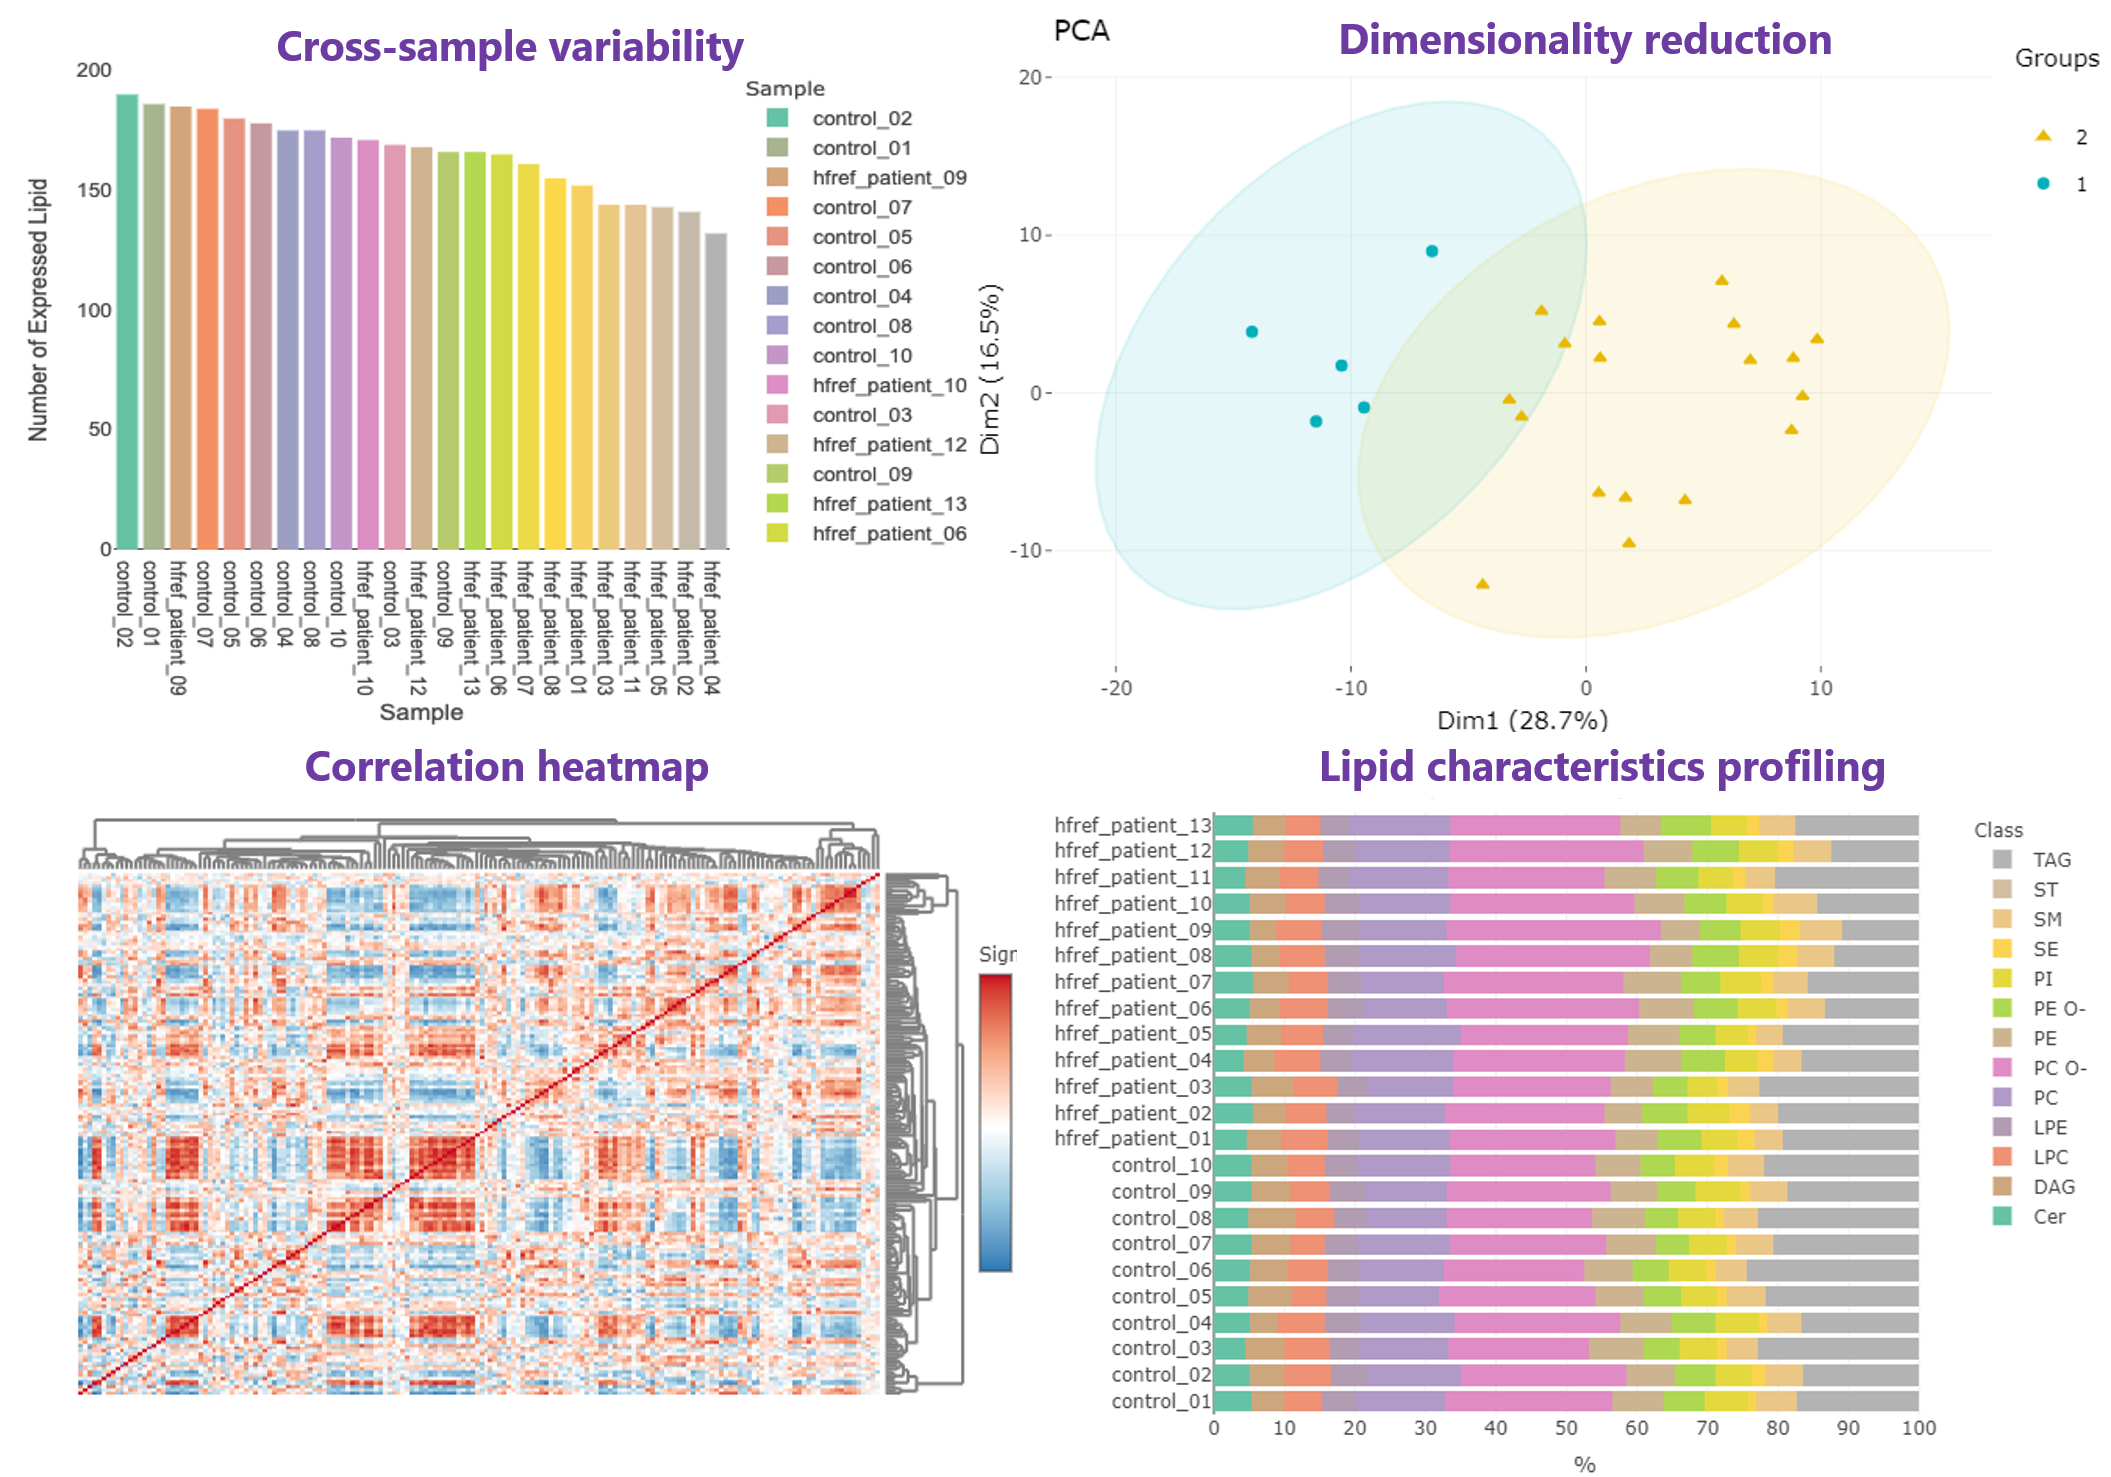
- In Profiling page, an overview gathering comprehensive analyses are offered for high-throughput screening, allowing researchers to efficiently explore the quality and the clustering of samples,correlation between lipids and samples, and the expression and composition of lipids.
- An application of lipid profiling can be found in Grzybek, Michal, et al. "Comprehensive and quantitative analysis of white and brown adipose tissue by shotgun lipidomics." Molecular metabolism 22 (2019): 12-20.
- Differential expression section assists users to identify significant lipid species or lipid characteristics (Fig.A). By utilising user-defined methods and characteristics, dimensionality reduction, hierarchical clustering, characteristics analysis, and enrichment (Fig.B) can be implemented based on the results of differential expressed analysis.
- Three examples of using differential expression analyses in lipid study:
- By Species :
- Zou, Yilong, et al. "Plasticity of ether lipids promotes ferroptosis susceptibility and evasion." Nature 585.7826 (2020): 603-608.
- By Characteristics :
- Levental, Kandice R., et al. "ω-3 polyunsaturated fatty acids direct differentiation of the membrane phenotype in mesenchymal stem cells to potentiate osteogenesis." Science advances 3.11 (2017): eaao1193.
- Hammerschmidt, Philipp, et al. "CerS6-derived sphingolipids interact with Mff and promote mitochondrial fragmentation in obesity." Cell 177.6 (2019): 1536-1552.
- In terms of the Machine learning analysis, this section comprises a broad variety of the user-defined feature selection methods and classifiers, as well as the other parameters for training the best model. It followed by a series of subsequent analyses to help users to evaluate the methods and visualise the results of machine learning.
- An example of using machine learning in lipidomics analysis:
- Gerl, Mathias J., et al. "Machine learning of human plasma lipidomes for obesity estimation in a large population cohort." PLoS biology 17.10 (2019): e3000443.
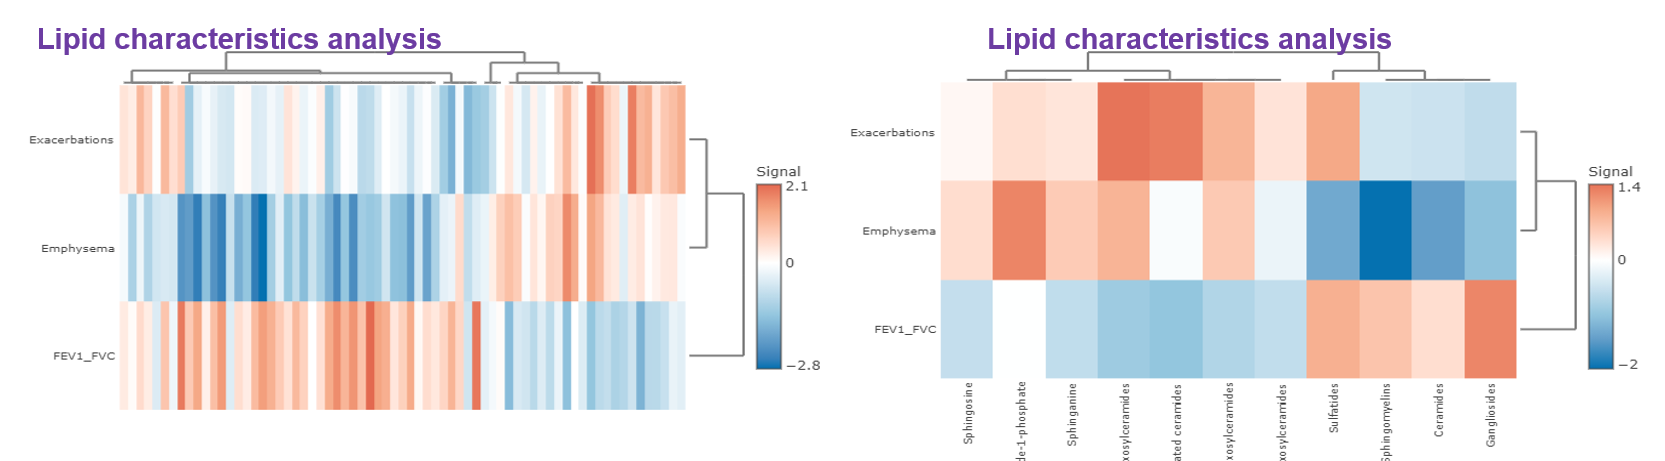
- Correlation analysis illustrates the relationship of the clinical features and the lipids species and other mechanistically relevant lipid characteristics, which has been applied to many fields of study, such as Bowler RP et al. discovering that sphingomyelins are strongly associated with emphysema and glycosphingolipids are associated with COPD exacerbations. Our platform provides diverse correlation, linear regression methods, and customised cut-offs to visualise the strength of association between clinical features and lipid species/characteristics.
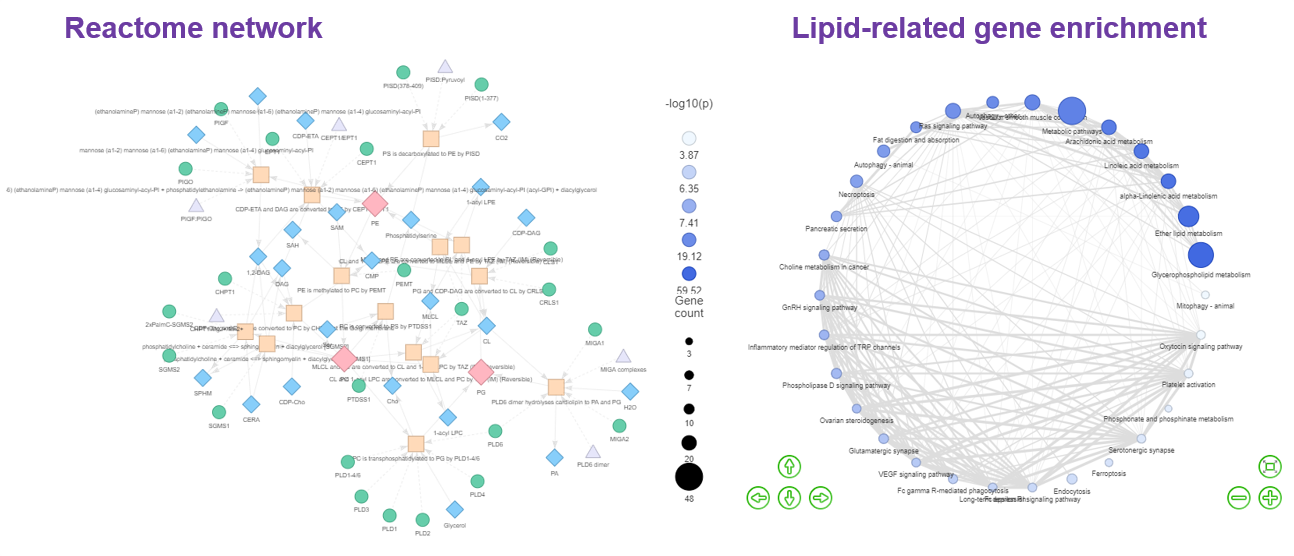
- As for Network , our platform constructs ‘Reactome pathway’ and ‘Lipid-related gene enrichment’ to interrogate the lipid metabolism pathways and lipid-related gene enrichment. By selecting different lipid classes, researchers can discover the metabolic networks between small molecules within Reactome Network topologies and their interactions with proteins in the ‘Reactome pathway’ function. In ‘Lipid-related gene enrichment’, a multi-omics analysis is applied to display the association of the lipids with gene function and a similar method has been used to identify relevant pathways of altered metabolites.
- An example of utilising Network to analyse fatty acid metabolism:
- Vantaku, Venkatrao, et al. "Multi-omics integration analysis robustly predicts high-grade patient survival and identifies CPT1B effect on fatty acid metabolism in bladder cancer." Clinical Cancer Research 25.12 (2019): 3689-3701.
FAQ 8: Can I download these figures? How to manipulate interactive figures in LipidSig?
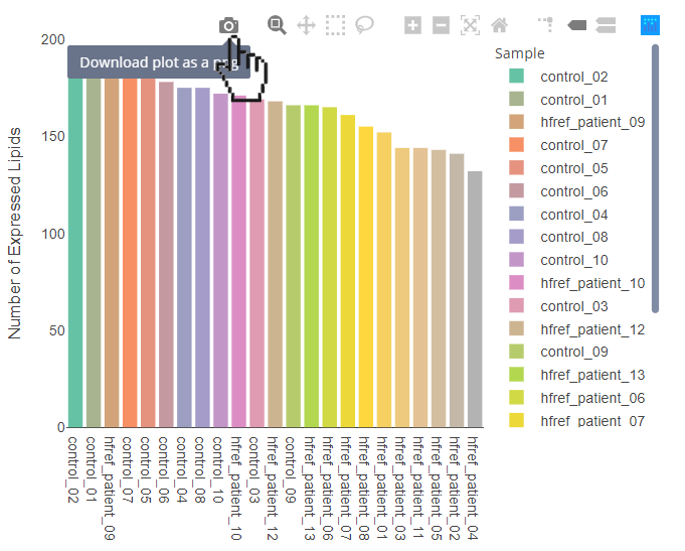
- Download the figure:
- Hover over the interactive figures to show tool bar. Press the camera icon on the far left.
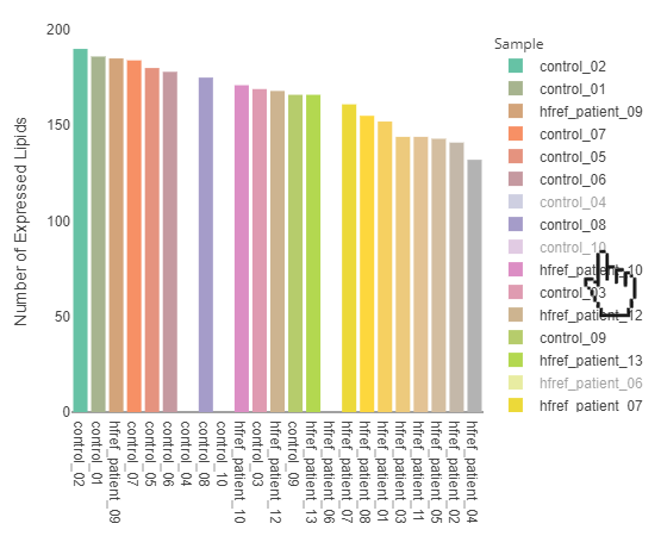
- Select specific sample types:
- By clicking the sample types of the legend, the specific sample types will be hid. By clicking the sample types again, the selected sample types will be shown on the plot.
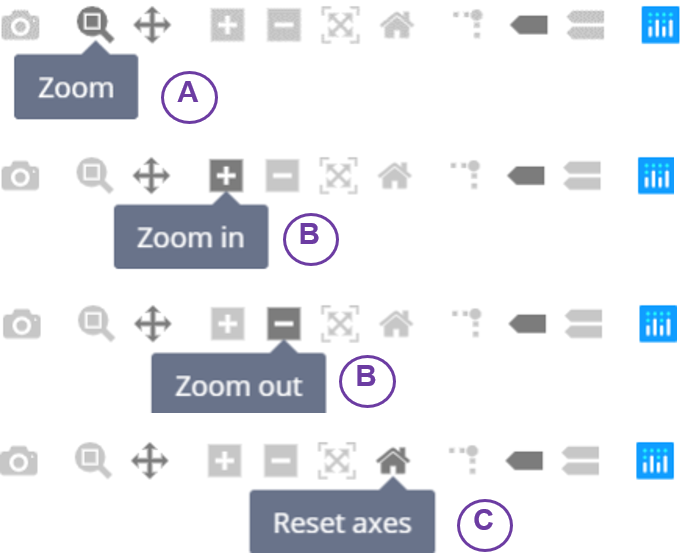
- Adjust your zoom level:
- By clicking the second button from the left, users can circle the area that you want to zoom in.
- The ‘Plus’ button is for zoom in, while the ‘minus’ button is for zoom out.
- If you want to back to the original setting, press the house-like button to reset it.